
Interest Rates and the US Housing Market
Interest Rates and the US Housing Market
Is the Market right About Opendoor?

Summary
The Case/Shiller home price index is up 45% since pre-covid levels
30y fixed rate mortgage rates have increased from 3.11% to 5.55% this year
This ain’t 2007: Historically low housing supply & no forced sales from ARMs
Opendoor priced for worst case, significant upside in all other scenarios
Unacceptably high inflation rates of more than 8% have forced central banks across the world to fight inflation hard. The FED is implementing the sharpest interest rate increases since 40 years. On the positive side, inflation was basically flat in the US month over month in July, and is again just 0.06% in August according to the Cleveland FED’s inflation nowcast. However, Jerome Powell stresses the 1970s as an example where the FED has cut interest rates too early and inflation came back. In order not to repeat this mistake, the FED seems determined to keep raising rates significantly at the next meetings. The market expects about 4% by year end and the most hawkish FED members want to see even more. This expectation is already reflected in long term market rates (while the FED funds rate is yet to increase if the FED sticks to its current plan).
After many years of zero interest rate policy (ZIRP), market are tanking in response to this interest rate shock. Stocks and and bonds are selling off. Used car prices are already rolling over according to the Manheim used car price index:
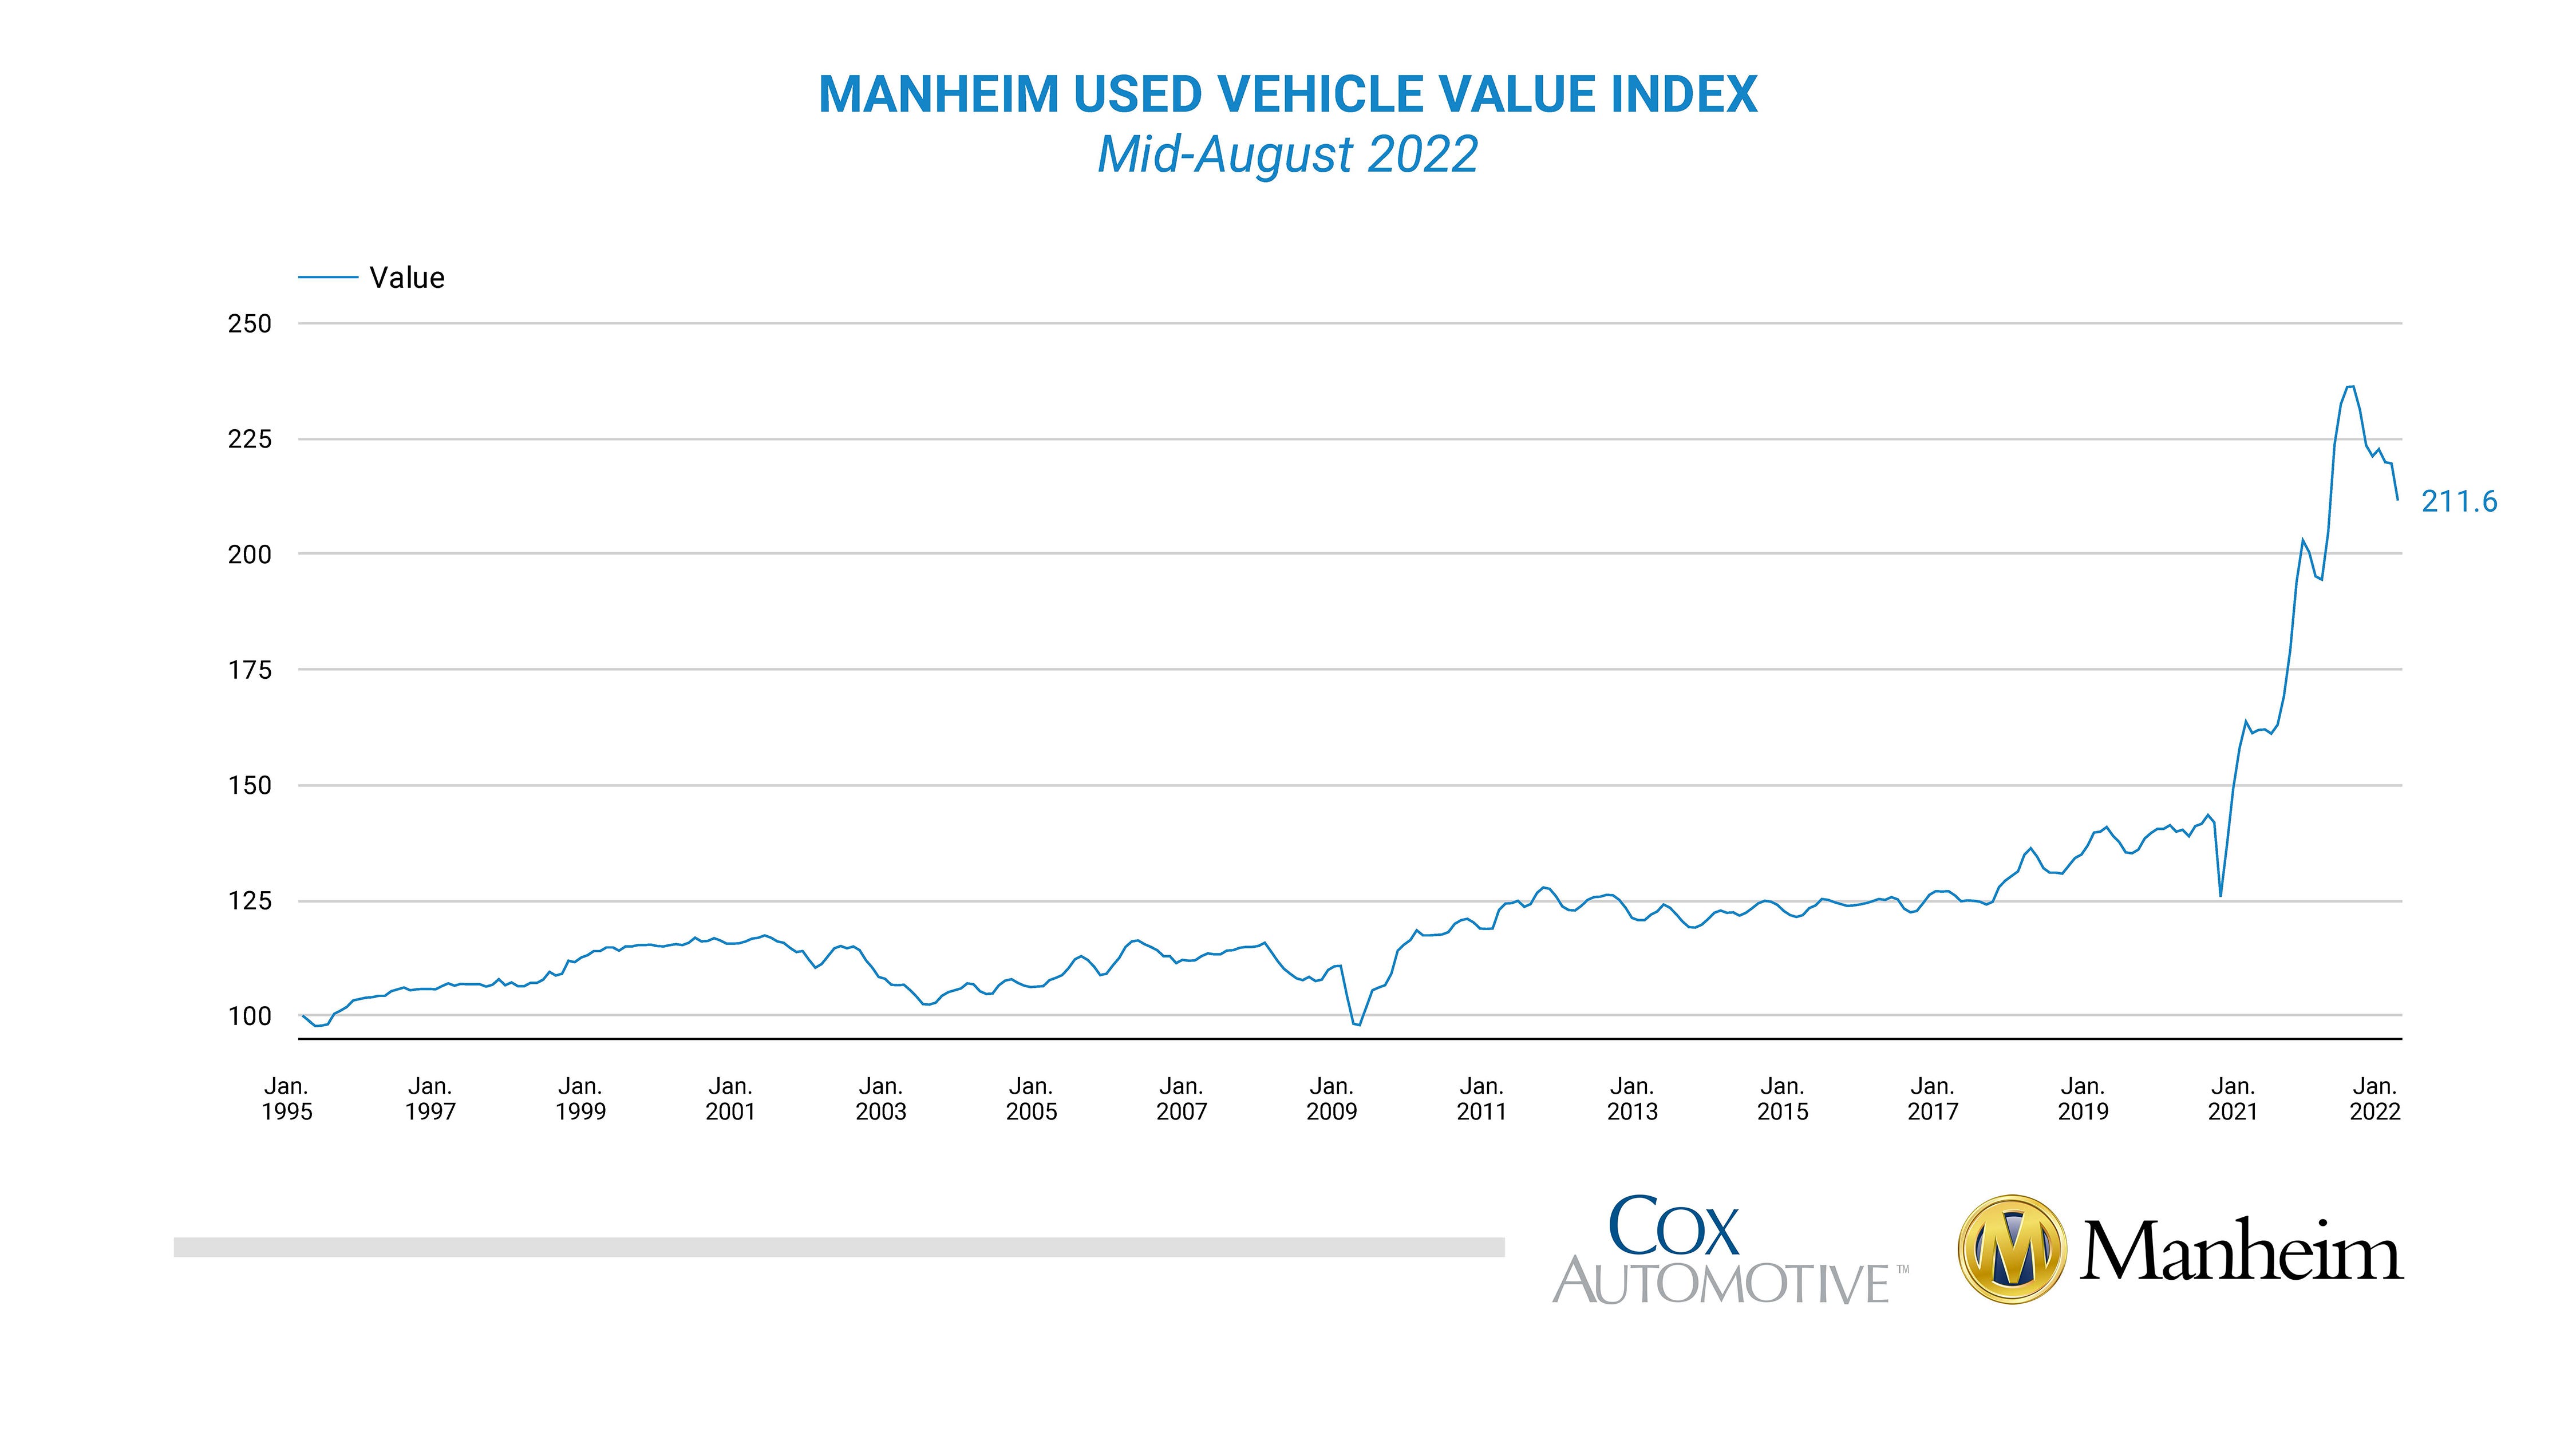
Used car prices have increased 70% since pre-covid levels due to a lack of supply, new car production shortages, and increased demand as people tried to avoid public transport and a car was one of the few means to achieve a sense of freedom during Covid lockdowns. In the last few months, the Manheim used car price index shows a steep decline. Prices are down 11% in just a few months and the chart is looking like a falling knife. The covid-related reasons to get a used car are mostly gone, moreover, inflation is hitting the affordability of many US citizens, and finally, used car production which was muted due to ship shortages is finally improving, or anticipated to improve. In sum, it is not surprising that some hot air is being let out of the used car market and I expect prices to continue to fall further (helping inflation come down).
Will the US Housing Market Crash Next?
In light of these developments it seems reasonable to ask if home price are the next asset to roll over. Since pre-covid levels early 2020, the Case/Shiller US home price index has increased 45%. At the same time, the US consumer price index has increased 15% over the same period, so in real terms, US home prices are up 30%.
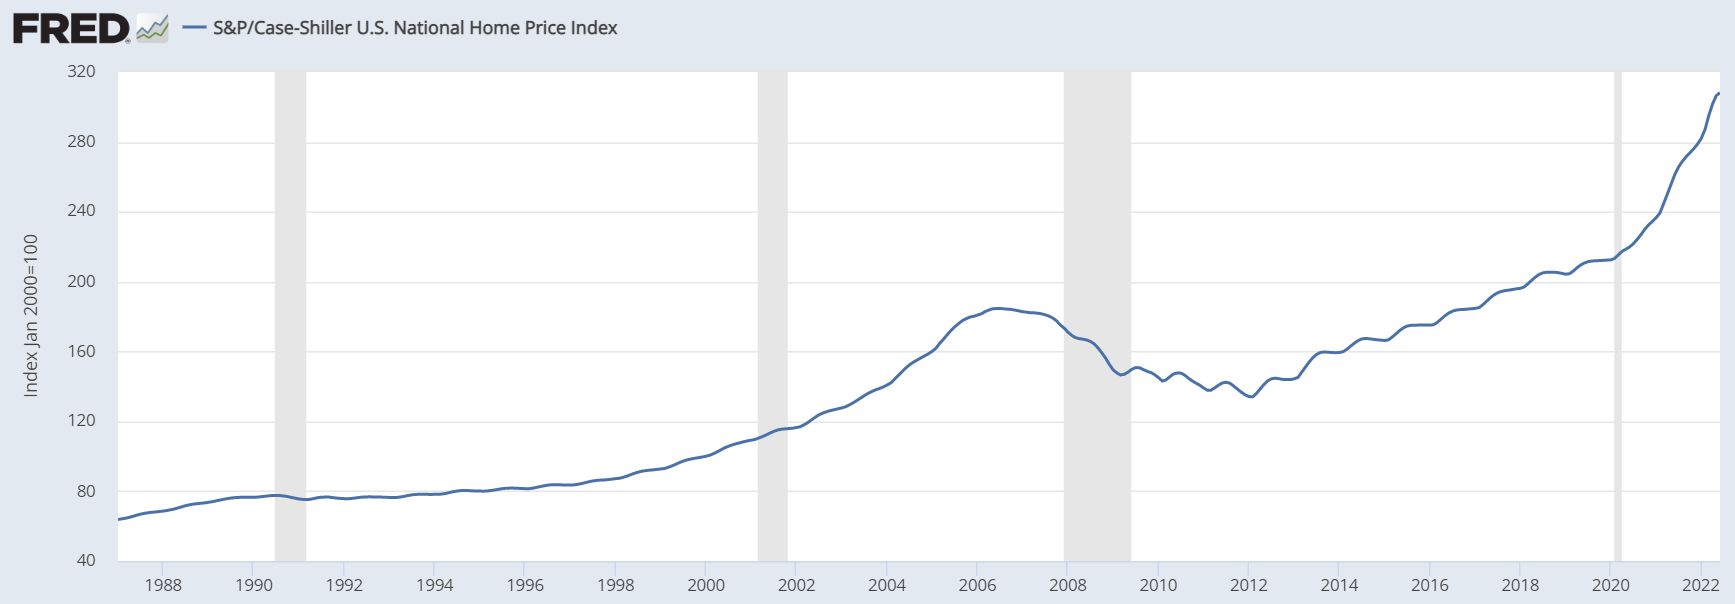
While most recent news suggest home prices have stopped growing at prior levels, the Case/Shiller index still shows no signs of a crash or even a correction.
While US home prices have gone up 45% since Covid, the move was much less pronounced than that for used car prices (70%). Moreover, it is important to note that the 45% increase came only after a rather modest price development over the past decades. Early 2020, home prices were just 15% higher than at the previous peak in 2007. Even now, the CAGR of US home prices since 2007 is just 3.5%.
Mortgage Rates and Affordability
Part of the 45% increase in home values since covid can certainly be attributed to low interest rates. In January 2021, the 30y fixed rate mortgage fell as low as 2.65%. In September 2022, mortgage rates have increased to 5.66%, so the affordability for debt-reliant home buyers has certainly decreased. Mortgage rates are now higher than at any other point in the last 10 years, reaching levels last seen prior to the Global Financial Crisis 2008.
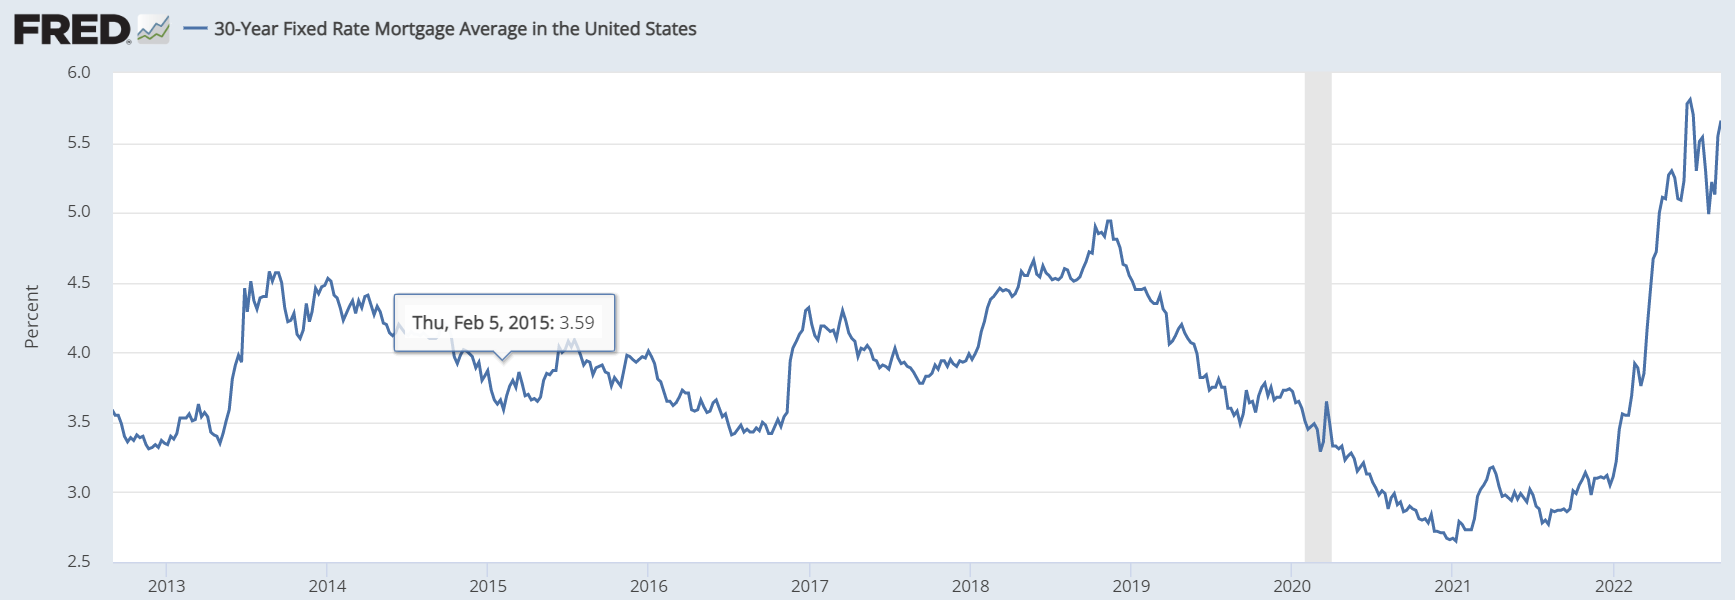
Mortgage rates do drive affordability. On the other hand, between 2012 and 2019, mortgage rates stayed exactly unchanged. At the same time, the Case / Shiller home price index increased 58%. Mortgage rates are therefore just one aspect of affordability, in particular for first time buyers. This does not hold for all cash buyers. Moreover, current owners can effectively switch homes at current market prices.
Income-Driven Affordability
The other side of affordability is income. Between 2007 and the end of 2021, GDP per capita in the US has increased 44%. Over the same period, the Case / Shiller Index has increased 52%. Put this way, the vast majority of home price increases since 2007 can be attributed to rising incomes.
Supply Shortage in the US Housing Market
The price of any good is a function of supply and demand. The US is a growing country. Since 2007, the population in the US has increased by about 10% from 300 million to 330 million. Naturally, this results in a growing demand for housing. At the same time, supply has not been keeping up. The US housing market is incredibly tight.
Homeowner vacancy is currently at only 0.8%, lower than at any other point since the US census report documents this number. In contrast, in 2007 availability was at an all time high of almost 3%. How realistic is it to expect a price crash for a good that is in dramatically low supply?
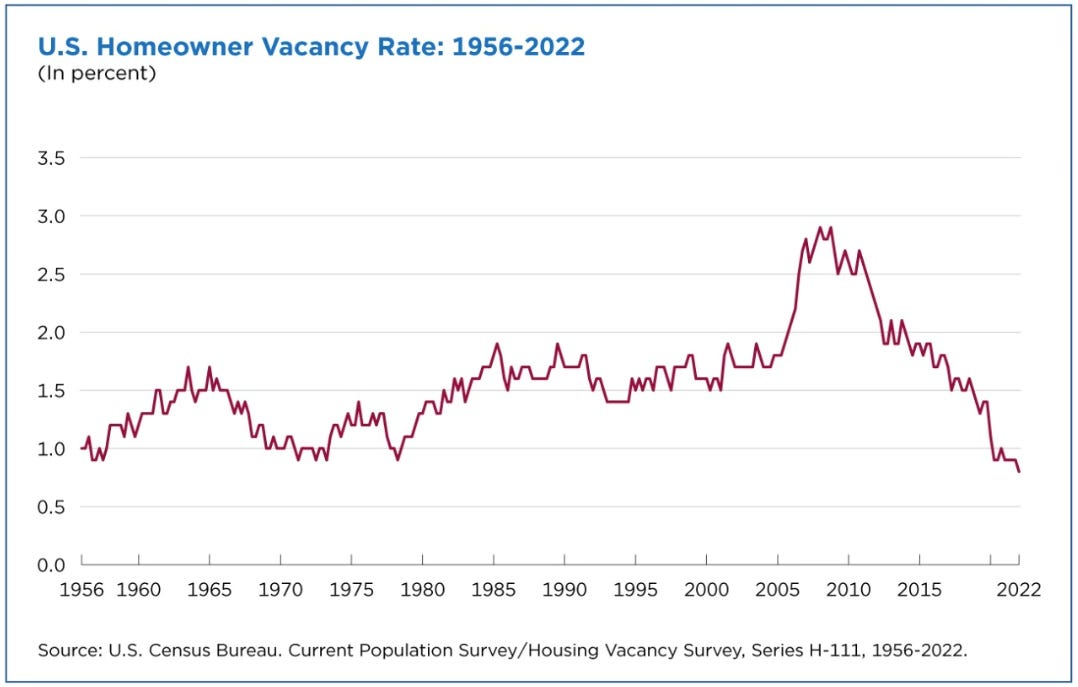
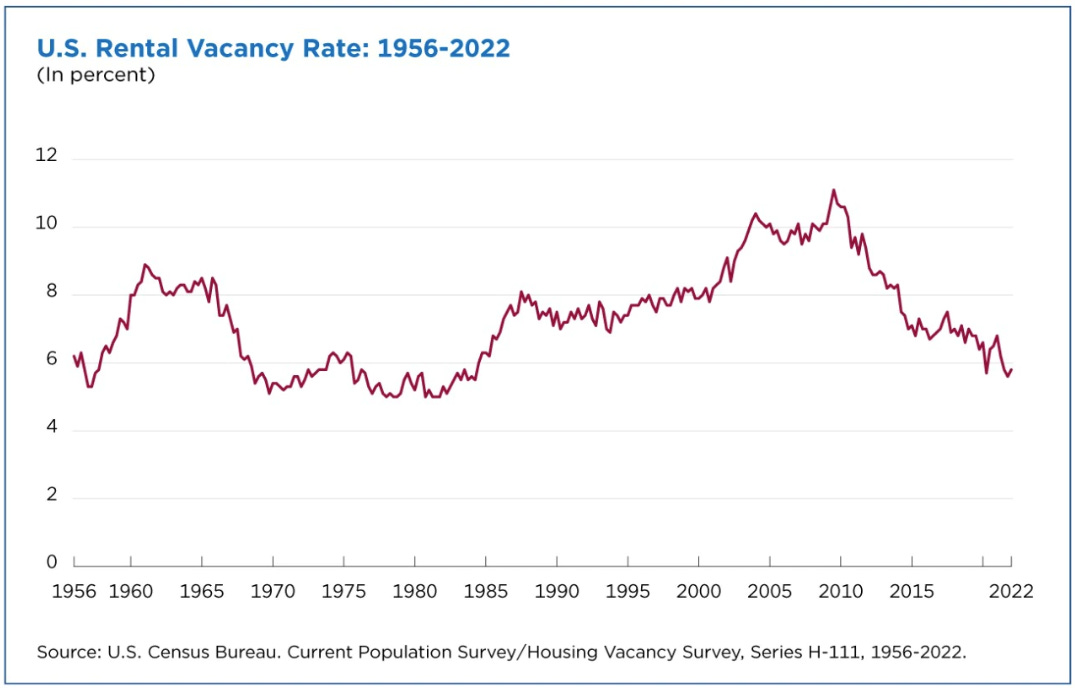
The rental vacancy rate shows a similar picture. Currently the national average is at 6%, just slightly above all time lows. This number was at a whopping 10% in 2007.
Forced Selling? The Role of Adjustable Rate Mortgages
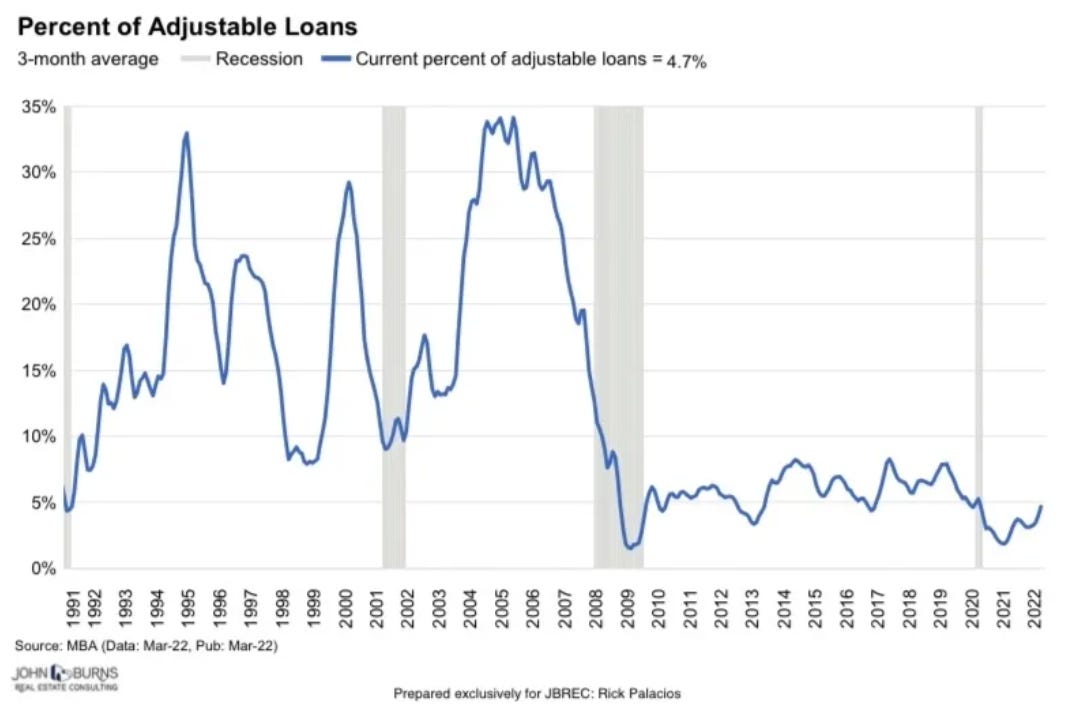
A key factor in the 2008 housing crash were adjustable rate mortgage loans. By that time about 30% of US homeowners had financed their homes with adjustable rate mortgage loans vs. fixed rate mortgage loans. As the FED increased the federal funds rate from 1% to more than 5% in just about 18 months, it was literally breaking the neck of dozens of millions of US citizens who were no longer able to service their mortgage loans and defaulted on them. The resulting massive forced selling in the US home market led to significant downward pressure in an already falling market. This forced selling played a major role in the Global Financial Crisis. With the recent FED action, will 2022 be similar?
The answer is clearly: no!
The percent of adjustable mortgage loans is down to just 5% at this point, which is immaterial in comparison to the more than 30% prior to the global financial crisis.
Conclusion
At least in nominal terms, home prices mostly go up in growing economies, due to 1) rising demand for a good tied to limited supply (land), 2) due to inflation, and 3) due to rising purchasing power if GDP per capita goes up. Occasionally, housing markets are subject to financial bubbles. This may have been the case in 2006. With the benefit of hindsight bias, we know that US home values fell 27.5% between 2006 until they reached their low in 2012. This represents a drop of about 5% per year, all while going through the most severe recession since the great depression of the 1930s.
In light of the strong recent increase in mortgage rates, the years of strong housing price increases may well be over, unless the FED pivots. If rates stay this high, or go even higher, will housing prices decline? Possibly. Will housing prices crash? I do not consider this a likely scenario at this point. Even between 2006 and 2008, housing prices only dropped 27.5% over 6 years.
In my opinion the most likely scenario is a correction. This could imply a rather fast drop of 5-10% over 1 or 2 years, or it could mean nominally flat prices during times of high inflation, leading to real prices declines over time. However, I do not share the expectation of a severe housing market crash that many other commenters seem to anticipate.
Opendoor
Together with Meta Platforms, Opendoor is my largest position currently. The share price appears to imply a worst case scenario of a massive short term crash in the US housing market, which would be a significant hit to Opendoor’s inventory of homes.
I am confident these worries are overblown. As documented in this article, home prices don`t move as fast as stocks. Even in the darkest moments of the Global Financial Crisis and during a wave of forced sales from subprime borrowers, the worst 3 month drop in US home values was a relatively modest -6.3% in January 2009.
In a nutshell, Opendoor makes about 10% in gross margin on each home it buys from a seller. 5% comes from the service fee, which is the typical broker fee any other real estate agent would also get. Another 5% comes from the “gain on sale.” When determining the offer price, Opendoor tries to anticipate the short term movement in home prices and applies a slight discount to the market value of the home. In return, the seller receives piece of mind, certainty, speed, convenience, and much more.
If home values suddenly drop 5%, Opendoor will loose its gain on sale, but still make 5% from the service fee. That holds for its current inventory. On a going forward basis, Opendoor is constantly selling off its inventory and buying new homes. For the new homes Opendoor currently buys, it can take into account the fact that prices have been falling 5% and that maybe prices are further slowly trending down.
Opendoor is vulnerable in a turning market as we are seeing now. When prices change from rising to flat or even falling in a short period of time, Opendoor will take a hit on inventory. But once the market is in a new equilibrium (e.g. flat or trending down), I expect Opendoor will over time revert back to a gross margin of 10%, even in a falling market. This seems to be beyond the comprehension of most market participants judging by the current share price (market cap = cash at this point). I expect a rough Q3 and maybe Q4 for Opendoor, but still with positive(!) gross margins. If the real estate market keeps falling, but Opendoor returns to 10% gross margins in 2023, it would prove wrong all its naysayers. In that scenario, I am expecting a significant rerate of the share price.